
Web Profiler
The Framefox web profiler is a powerful debugging and performance monitoring tool that provides detailed insights into your application’s behavior during development. It automatically captures comprehensive data about every HTTP request and presents it through an intuitive web interface.
Overview
Section titled “Overview”The profiler system transforms debugging from guesswork into precise analysis by automatically capturing detailed information about every HTTP request processed by your Framefox application. Think of it as your application’s black box recorder - it tracks everything that happens during a request so you can understand exactly what went right or wrong.
Key Monitoring Areas:
- Request/Response Analysis: Complete HTTP transaction details with headers, parameters, and timing
- Database Monitoring: Every SQL query with execution times and performance metrics
- Memory Tracking: Real-time memory usage and peak consumption monitoring
- Exception Handling: Full stack traces for Python exceptions and HTTP errors
- Log Collection: Centralized application logs with context and intelligent filtering
- Routing Information: Controller methods, templates, and routing decision details
- Performance Metrics: Comprehensive execution time breakdown and bottleneck identification
Configuration via debug.yaml
Section titled “Configuration via debug.yaml”The profiler is configured through the config/debug.yaml file, which serves as the central control panel for all debugging features in Framefox. This file allows you to fine-tune the profiler’s behavior without touching your application code.
debug: profiler: enabled: true # Enable the profiler max_files: 1000 # Maximum number of profile files per day retention_days: 7 # Number of days to retain profiles sampling_rate: 1.0 # Percentage of requests to profile (0.0 to 1.0) max_memory: 50 # Maximum profiles in memory logging: level: "DEBUG" # Log level when dev (DEBUG, INFO, WARNING, ERROR, CRITICAL) file_path: "var/log/app.log" max_size: 10 # Maximum file size backup_count: 5 # Number of backup filesUnderstanding debug.yaml Structure
Section titled “Understanding debug.yaml Structure”The debug.yaml file is organized into logical sections that control different aspects of the debugging experience:
Profiler Section (debug.profiler):
- enabled: Master switch that controls whether the profiler collects data
- max_files: Daily limit for profile files to prevent disk space issues
- retention_days: Automatic cleanup period for old profile data
- sampling_rate: Performance control - profile only a percentage of requests
- max_memory: Memory cache limit to prevent RAM overconsumption
Logging Section (debug.logging):
- level: Controls the verbosity of debug information
- file_path: Location where debug logs are stored
- max_size: Prevents log files from growing too large
- backup_count: Number of rotated log files to maintain
Environment-Based Activation
Section titled “Environment-Based Activation”The profiler automatically activates only in development mode (app_env = "dev"), ensuring zero performance impact in production. This safety mechanism prevents accidental profiling in live environments while maintaining full functionality during development.
Profiler Interface Walkthrough
Section titled “Profiler Interface Walkthrough”Main Profile List Interface
Section titled “Main Profile List Interface”When you navigate to /_profiler, you’re greeted with a comprehensive overview of all captured request profiles. This interface serves as your mission control for understanding your application’s behavior.
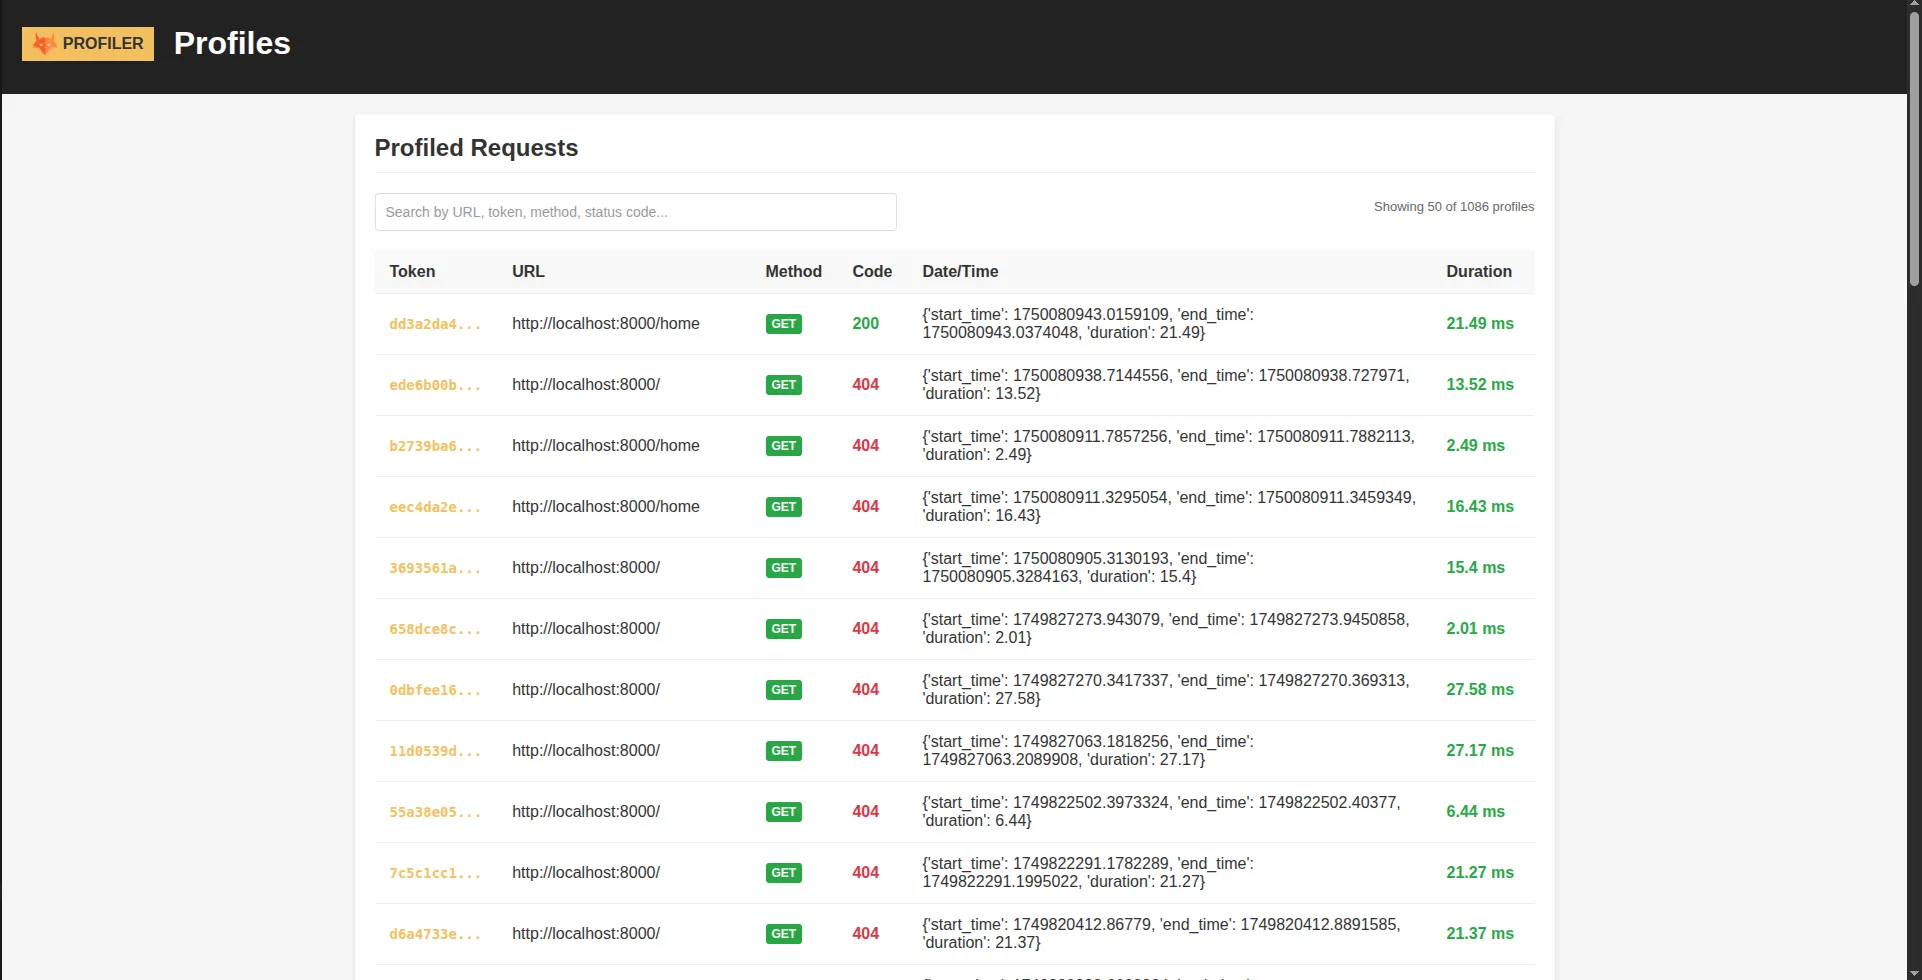
Interface Elements:
- Search and Filter Bar: Quickly locate specific requests by URL, method, or status code
- Sortable Columns: Click any column header to sort by duration, timestamp, or status
- Visual Indicators: Color-coded performance and error indicators for quick problem identification
- Pagination Controls: Navigate through large datasets without performance degradation
- Quick Actions: Direct links to detailed analysis for each request
Understanding the Data Display:
- Token: Unique identifier for each request - think of it as a fingerprint
- URL: The requested endpoint with smart truncation for long URLs
- Method: HTTP method with color coding (GET=green, POST=blue, DELETE=red)
- Status Code: Response status with visual success/error styling
- Timestamp: Precise moment when the request was processed
- Duration: Request processing time with performance level indicators
Detailed Profile Analysis
Section titled “Detailed Profile Analysis”Clicking on any profile token opens the detailed analysis view - this is where the real debugging power becomes apparent. The interface is organized into specialized panels, each focusing on a specific aspect of the request lifecycle.
Request Panel - Understanding the HTTP Transaction
Section titled “Request Panel - Understanding the HTTP Transaction”The Request panel provides a complete picture of the HTTP transaction, from the initial client request to the final server response.
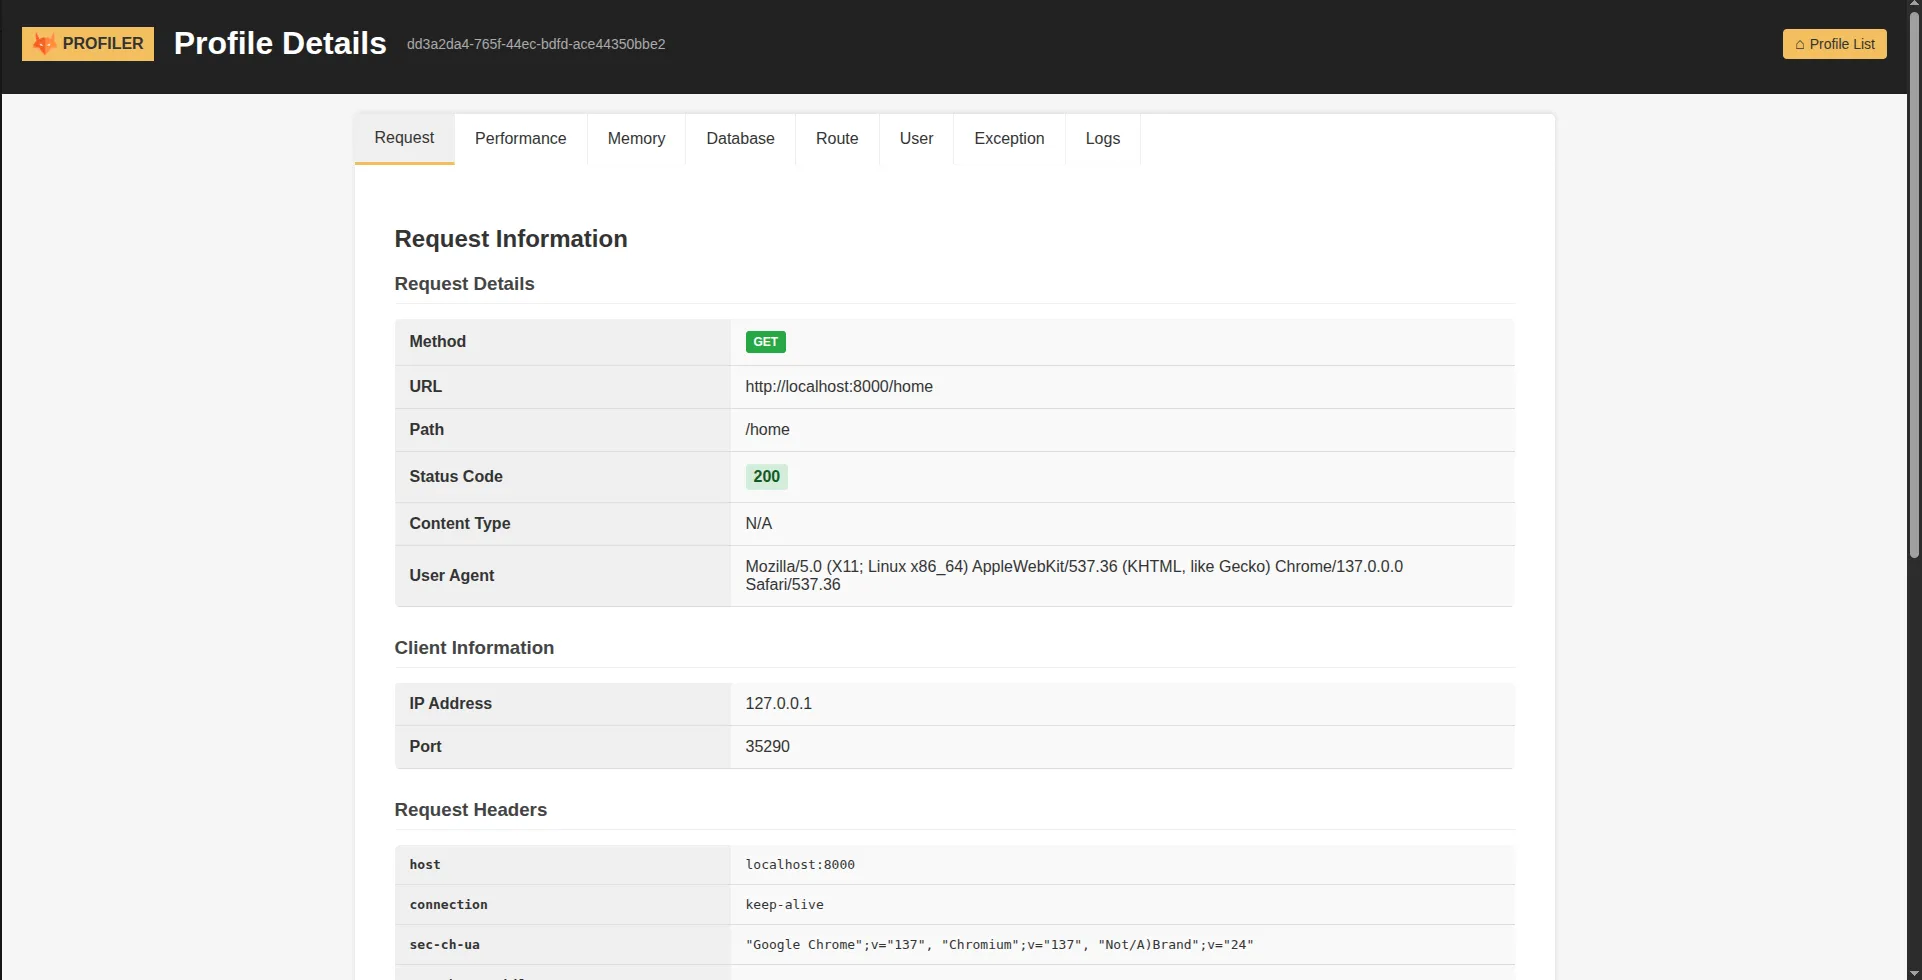
What You’ll See:
- HTTP Method and URL: The exact request that was made
- Request Headers: Complete header information with automatic filtering of sensitive data
- Query Parameters: URL parameters broken down for easy analysis
- Form Data: POST/PUT/PATCH body data with security masking for passwords and tokens
- Client Information: IP address, user agent, and referrer for request context
- Response Headers: Server response headers and metadata
The profiler automatically protects sensitive information by masking passwords, API keys, and authentication tokens, ensuring your security credentials never appear in debug data.
Database Panel - SQL Query Analysis
Section titled “Database Panel - SQL Query Analysis”Database operations are often the biggest performance bottleneck in web applications. The Database panel provides comprehensive SQL query analysis to help you identify and optimize database interactions.
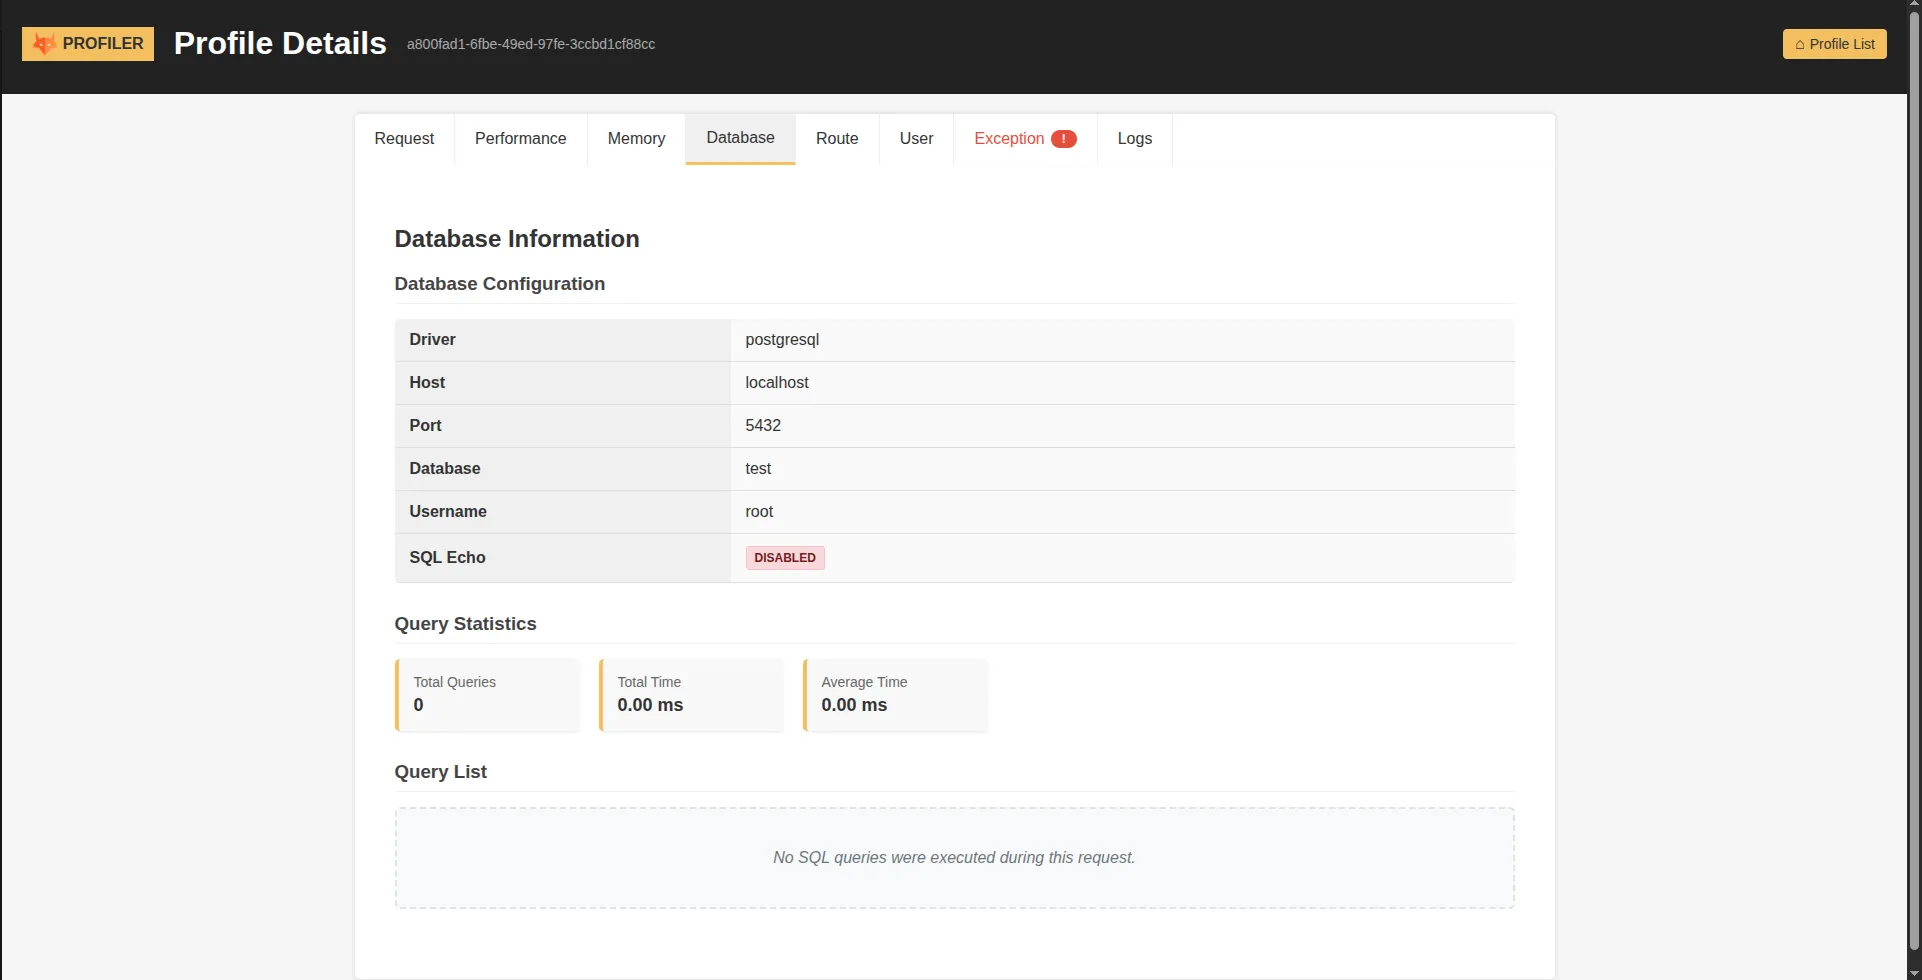
Query Analysis Features:
- Complete Query List: Every SQL statement executed during the request
- Execution Timing: Precise millisecond timing for each query
- Query Parameters: Actual parameter values used in prepared statements
- Performance Metrics: Query count, total duration, and average execution time
- Syntax Highlighting: Color-coded SQL for better readability
- Database Configuration: Connection details and database settings
Performance Insights: The panel highlights slow queries and provides statistics that help you understand database performance patterns. You can quickly identify N+1 query problems, slow joins, or missing indexes.
Exception Panel - Error Analysis
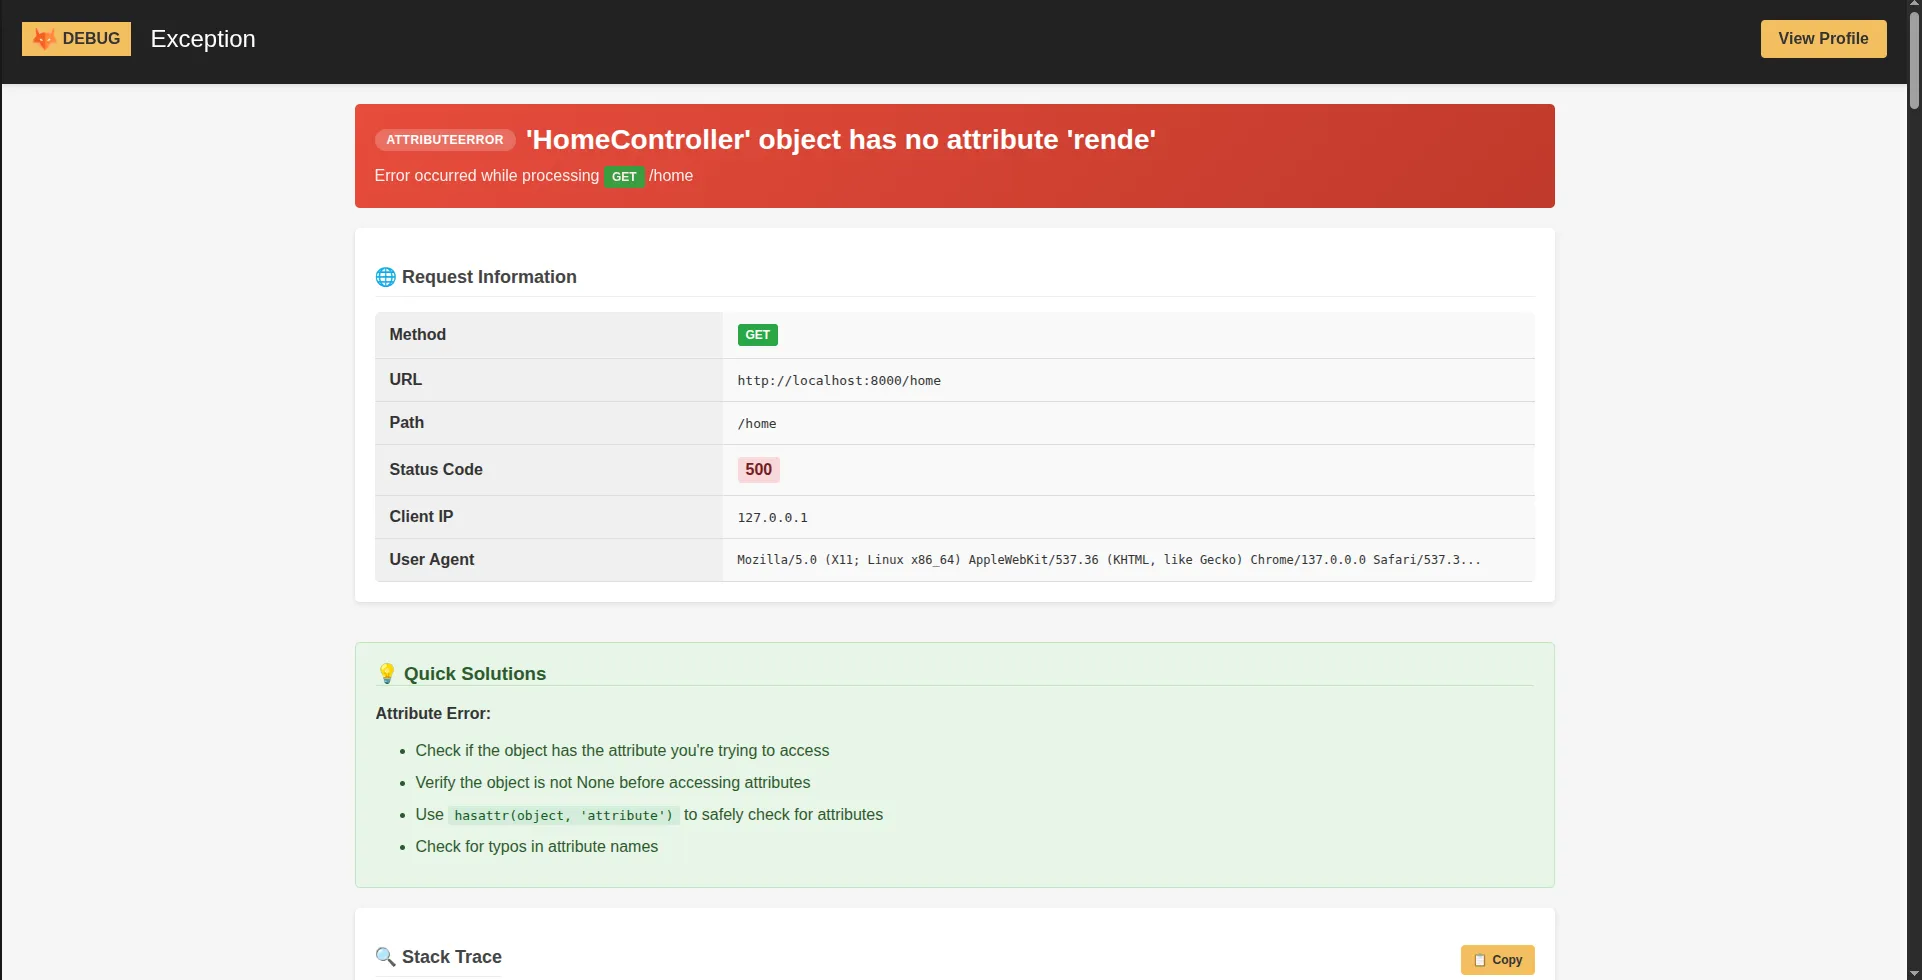
Section titled “Exception Panel - Error Analysis”When things go wrong, the Exception panel becomes your primary debugging tool. It captures both Python exceptions and HTTP errors with comprehensive context information.
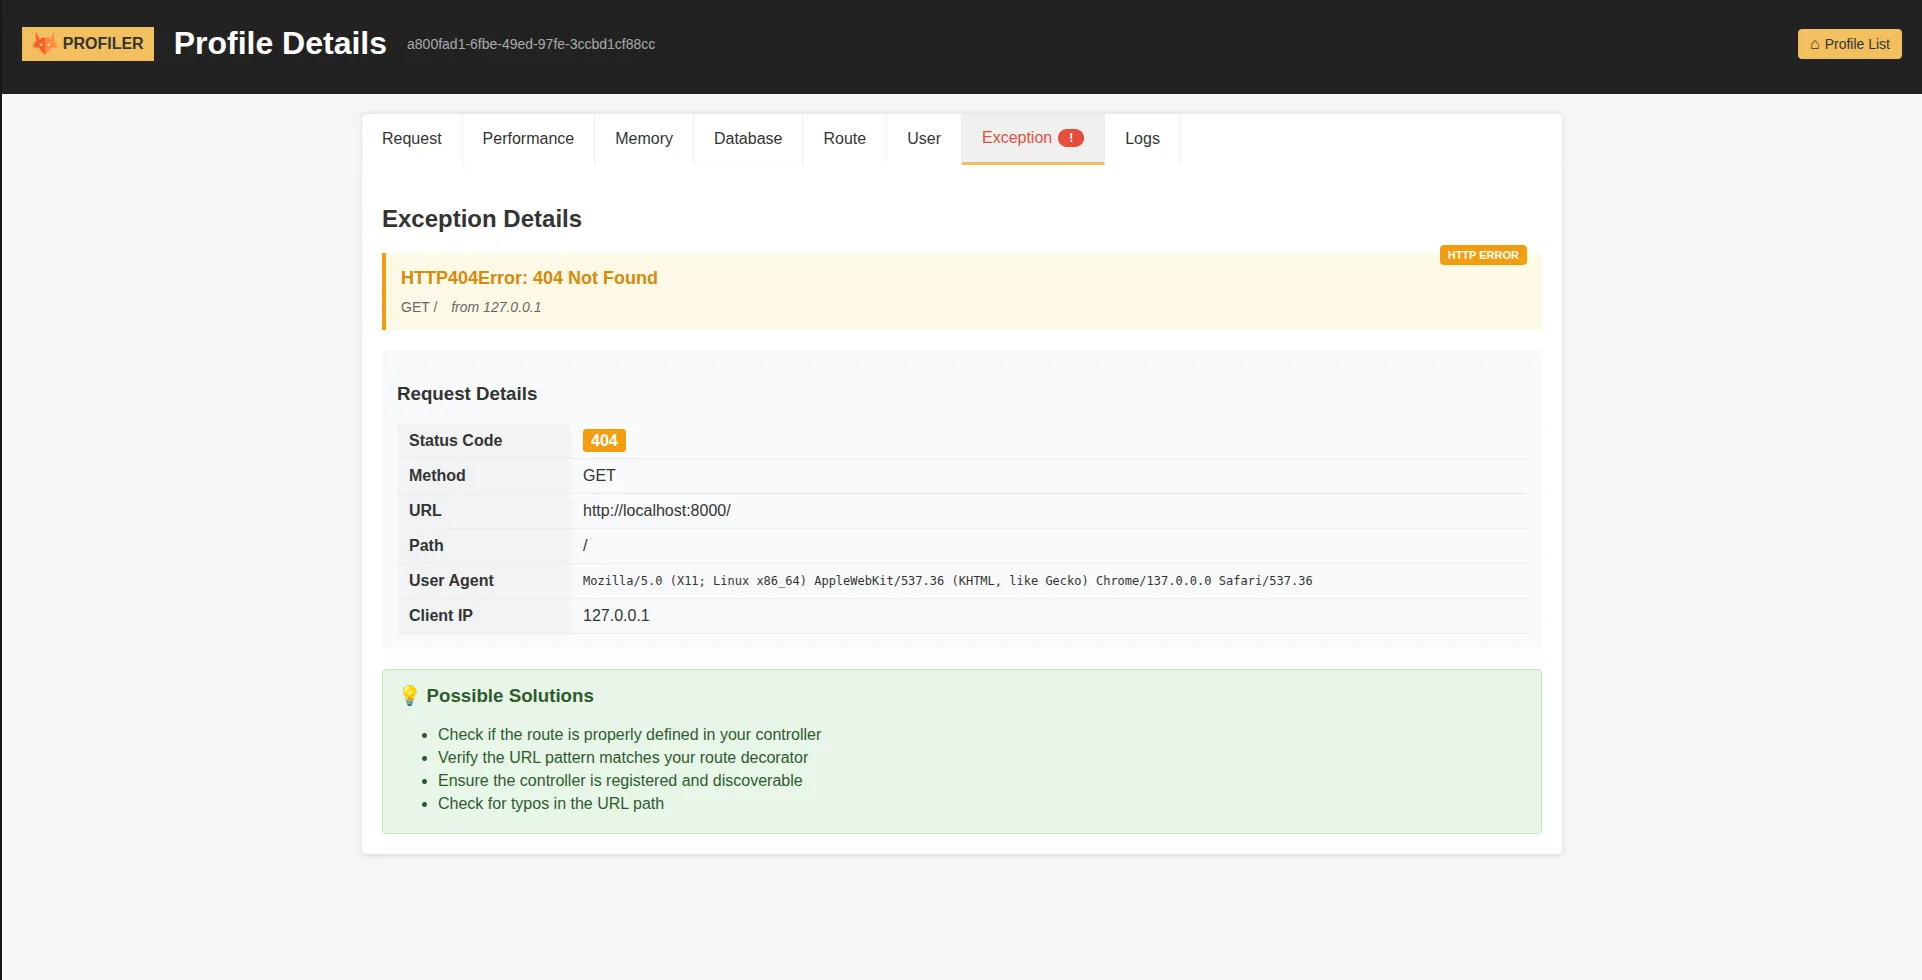
Exception Information:
- Full Stack Traces: Complete file and line information for Python exceptions
- Exception Details: Class name, error message, and error codes
- HTTP Error Context: Request context for 4xx and 5xx responses
- Debugging Suggestions: Helpful hints based on the error type
- Error Timeline: When and where the exception occurred in the request lifecycle
Error Context Preservation: The profiler maintains the complete context when an error occurs, including the request state, user information, and application state at the moment of failure.
You can also access each profiler linked to an exception when it occurs:
Logs Panel - Application Log Analysis
Section titled “Logs Panel - Application Log Analysis”The Logs panel aggregates all application logging output that occurred during the request, providing a chronological view of your application’s behavior.
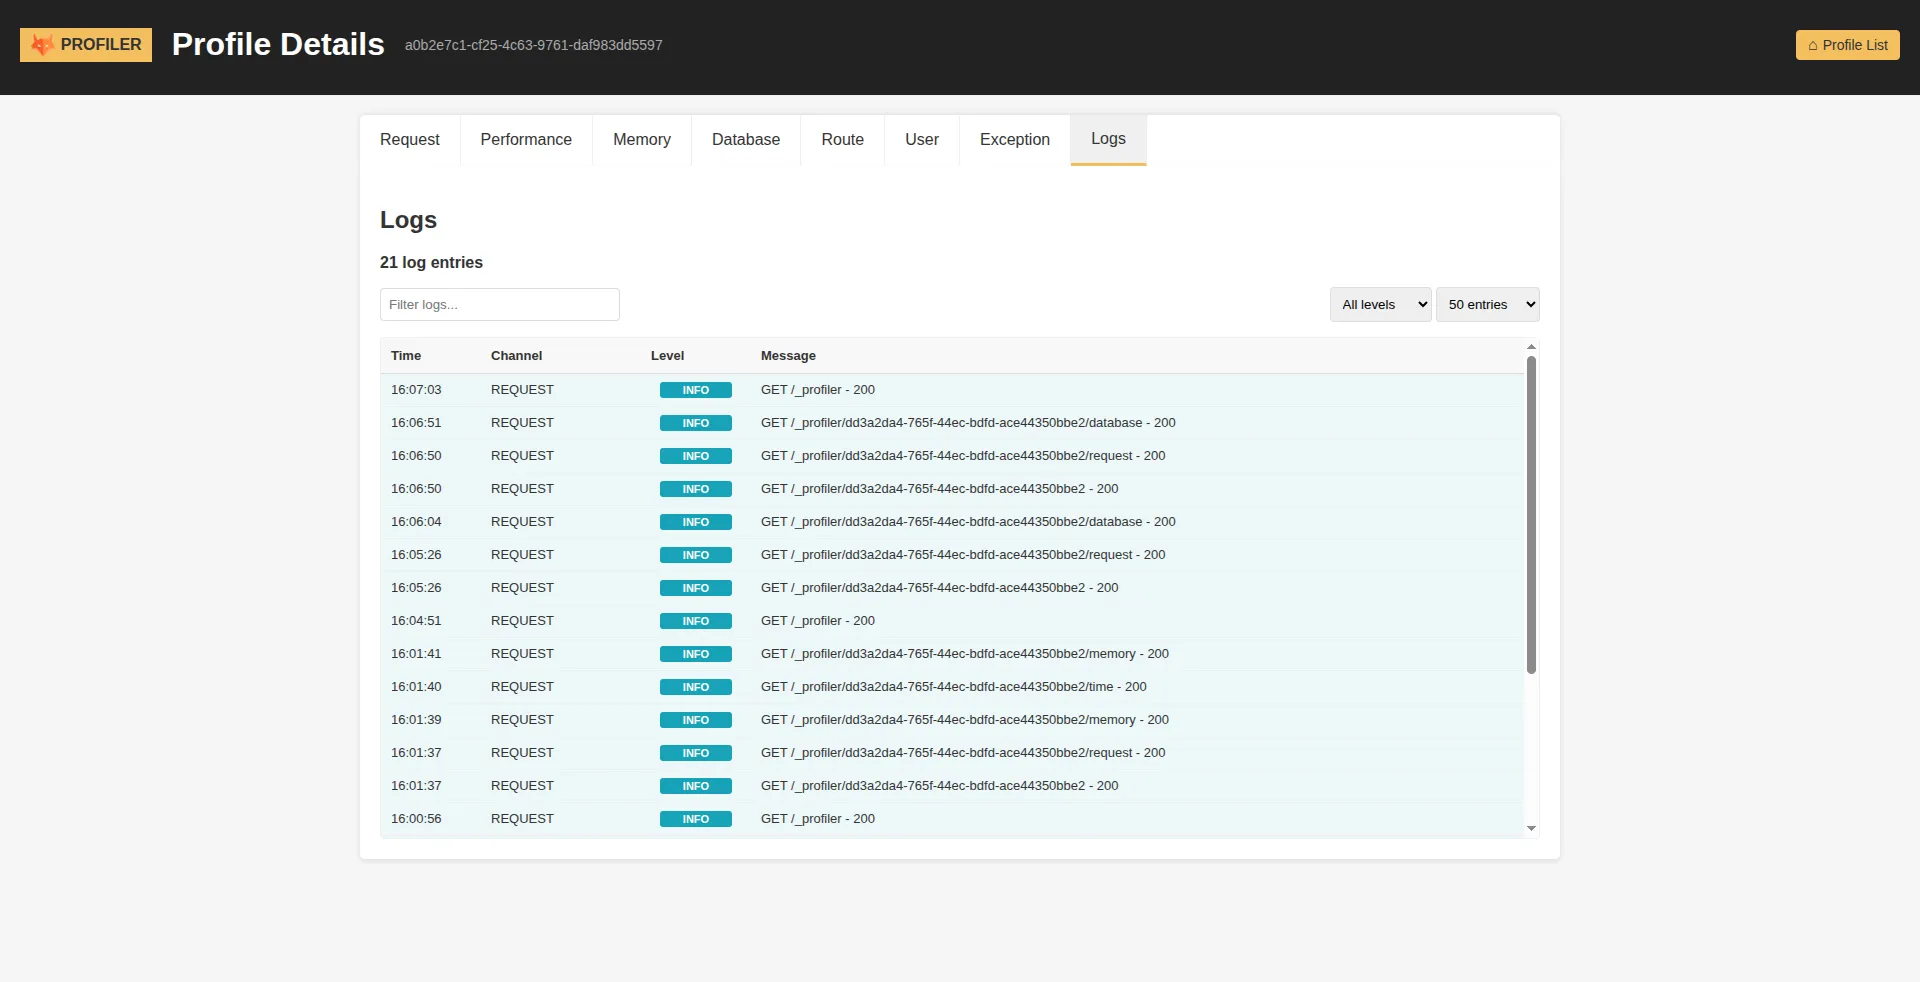
Log Management Features:
- Request-Scoped Filtering: Only shows logs relevant to the current request
- Level-Based Filtering: Filter by DEBUG, INFO, WARNING, ERROR, or CRITICAL levels
- Smart Search: Find specific log messages using text search
- Error Count Statistics: Quick overview of error distribution
- Timestamp Precision: Exact timing of each log entry
- Context Preservation: Maintains log context and metadata
Interactive Features:
- Real-time Filtering: Filter logs by level or search terms without page reload
- Load More: Pagination for requests with extensive logging
- Clear Filters: Quick reset to view all logs
Memory Panel - Resource Usage Analysis
Section titled “Memory Panel - Resource Usage Analysis”Understanding memory consumption is crucial for application performance. The Memory panel provides detailed insights into your application’s memory usage patterns.
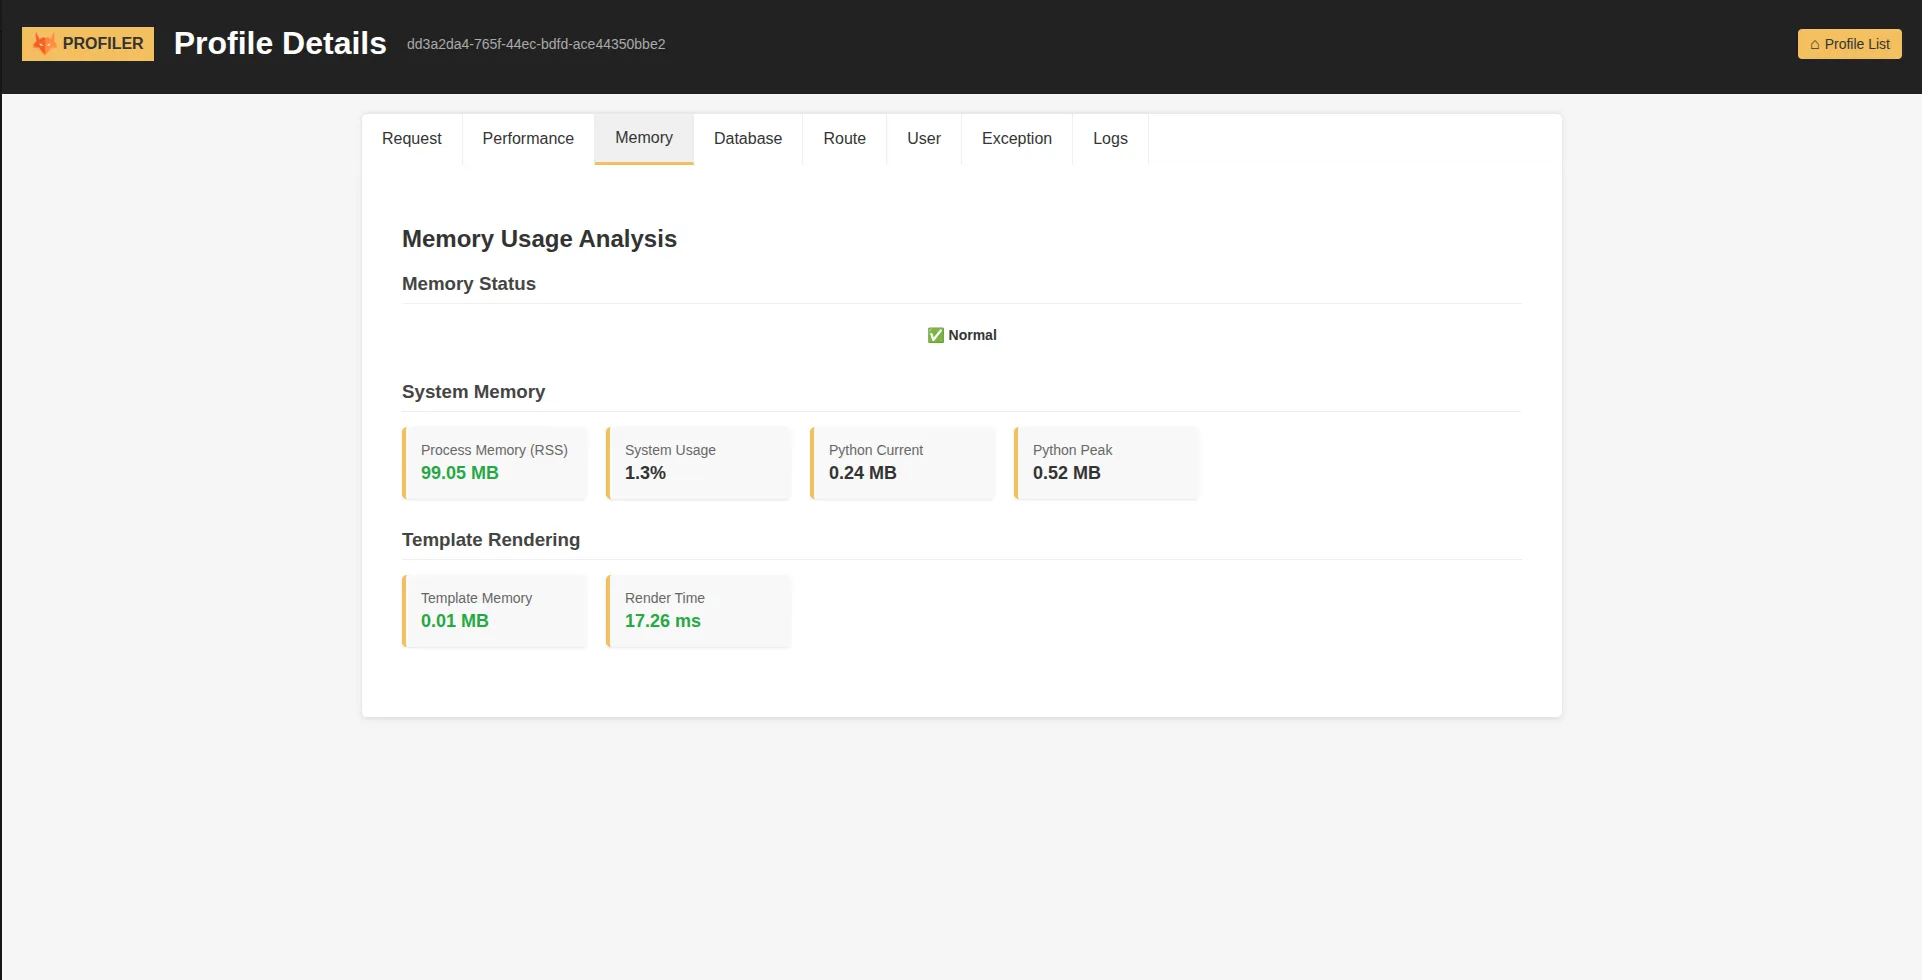
Memory Metrics:
- Current Memory Usage: Real-time memory consumption in MB
- Peak Memory Consumption: Maximum memory used during the request
- Memory Allocation Patterns: How memory usage changed throughout the request
- Resource Efficiency: Memory usage relative to request complexity
Route Panel - Routing Information
Section titled “Route Panel - Routing Information”The Route panel demystifies how Framefox matched the incoming request to your controller and provides complete routing context.
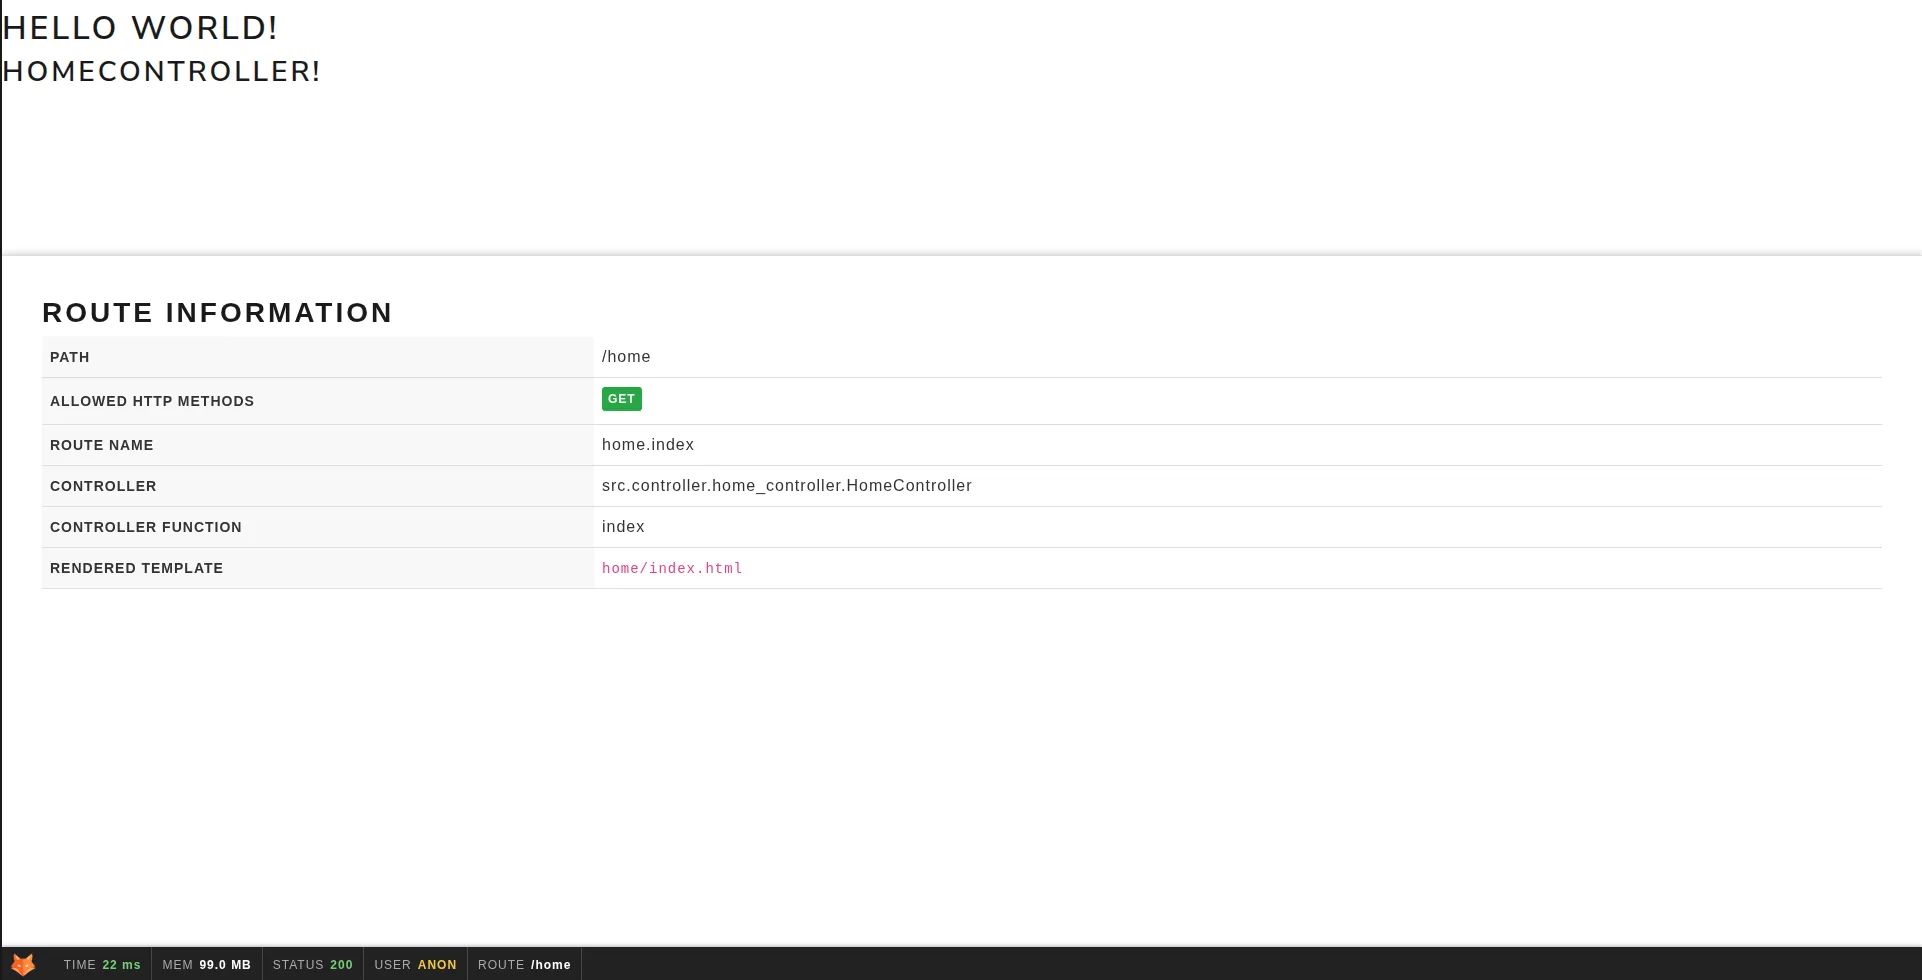
Routing Details:
- Controller Information: Which controller class and method handled the request
- Route Patterns: The URL pattern that matched the request
- HTTP Methods: Allowed methods for the matched route
- Template Information: Which template was rendered (if applicable)
- Route Parameters: Extracted parameters from the URL pattern
- Endpoint Metadata: Additional routing configuration details
User Panel - Current Logged User Information
Section titled “User Panel - Current Logged User Information”Knowing if a user is logged can be useful during development. With this tab you can retrieve current user and every information linked to the auth method used and firewall.

User Information:
- Authentication Status: Whether a user is currently logged in
- User Details: Complete user profile and metadata
- Authentication Method: How the user authenticated (form, OAuth, JWT, etc.)
- Firewall Configuration: Active security rules and permissions
- Session Information: Session data and expiration details
- Role and Permissions: User roles and access rights
Debug Toolbar Integration
Section titled “Debug Toolbar Integration”For HTML responses, Framefox automatically injects a compact debug toolbar at the bottom of your pages. This toolbar provides instant access to profiling information without disrupting your application’s interface.
Toolbar Features:
- Fixed Position: Always visible at the bottom of the page
- Quick Metrics: Instant view of key performance indicators
- Color-Coded Indicators: Visual performance and error status
- One-Click Access: Direct link to detailed profiler analysis
- Minimal Footprint: Designed to not interfere with your application
Automatic Injection: The toolbar is automatically injected into HTML responses when:
- The profiler is enabled
- The response is HTML content
- The page contains a closing
</body>tag - The request is not a redirect

Security and Data Protection
Section titled “Security and Data Protection”The Framefox profiler is designed with security as a primary concern. It automatically protects sensitive information while providing comprehensive debugging capabilities.
Automatic Data Protection:
- Password Masking: All password fields are automatically replaced with
***FILTERED*** - Token Security: API keys, authentication tokens, and session IDs are protected
- Header Filtering: Sensitive HTTP headers like Authorization and Cookie are masked
- Personal Information: Credit card numbers, SSNs, and personal data are automatically detected and protected
Production Safety: The profiler includes multiple safety mechanisms to prevent accidental activation in production environments:
- Environment Detection: Only activates in development mode
- Zero Production Impact: No performance overhead when disabled
- Automatic Cleanup: Old profile data is automatically removed
- Resource Limits: Built-in limits prevent resource exhaustion
Performance Optimization
Section titled “Performance Optimization”The profiler is designed to provide comprehensive debugging information while minimizing impact on your application’s performance.
Storage Management: Profile data is organized in a hierarchical structure by date, making it easy to locate specific profiles while enabling efficient cleanup of old data.
Sampling Configuration: For high-traffic applications, you can configure sampling to profile only a percentage of requests, reducing overhead while still capturing representative data.
Automatic Exclusions: The profiler automatically excludes certain types of requests that typically don’t need profiling:
- Static asset requests (CSS, JS, images)
- Profiler interface requests
- Favicon requests
- Health check endpoints
Troubleshooting Common Issues
Section titled “Troubleshooting Common Issues”When the profiler doesn’t work as expected, there are several common causes and solutions.
Profiler Not Appearing: The most common issue is environment configuration - ensure you’re running in development mode and the profiler is enabled in debug.yaml.
Missing SQL Queries: Database query collection depends on proper logging configuration. The profiler integrates with SQLAlchemy and SQLModel loggers to capture database activity.
Performance Impact: If you notice performance degradation, consider adjusting the sampling rate or reducing the number of profiles kept in memory.
Memory Issues: For applications with high request volumes, you may need to reduce the max_files and max_memory settings to prevent resource exhaustion.
The Framefox Web Profiler transforms the debugging experience from reactive troubleshooting to proactive performance optimization. By providing comprehensive insights into every aspect of your application’s behavior, it empowers developers to build faster, more reliable applications with confidence.